
As a developer, you would need design and implement the components in a way that it doesn’t affect the performance. Sitecore’s Debug mode helps you to check if the components are performing to its optimal level.
Google has indicated site speed is one of indicator for search ranking. Google might be specifically measuring time to first byte as when it considers page speed. In addition, a slow page speed means that search engines can crawl fewer pages using their allocated crawl budget, and this could negatively affect your indexation.
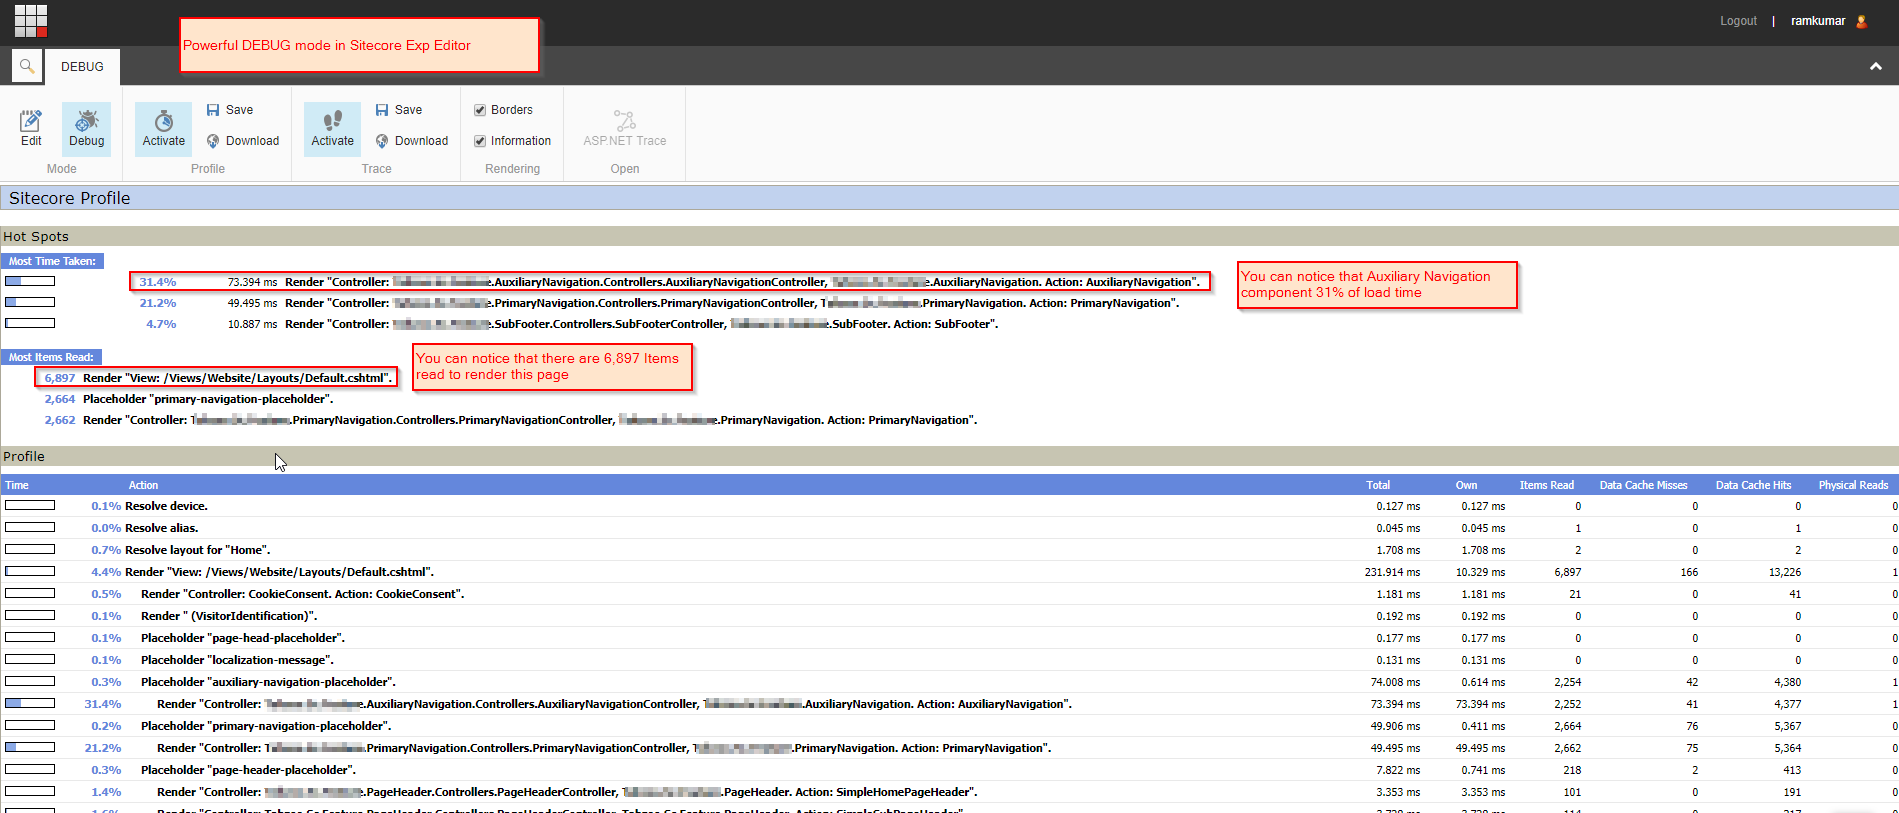
You can get a complete trace of any page by viewing it in powerful Debug mode in Sitecore Experience Editor. You can notice in below image that some components take longer than others to load. This trace report will help to give you a list of components and their respective load times. Using this report you can try to improve component load times there by increasing performance of the page.
Try follow best practices while creating components, especially when designing listing components.
In the below example you will notice a simple take statement which is used to retrieve maximum number of items that are bound to listing component. Say there are 2000 items that is returned by query and you need to bind just 5 items in your component then #2 retrieves all 2000 items and then takes 5 items compared to #1 which will get only 5 items through Content Search Linq Helper. Simple statements like these might make a HUGE impact in performance.
Used along with LinqHelper
 using (var context = ContentSearchManager.GetIndex($"sitecore_{_currentDbName}_index").CreateSearchContext())
            {
                var searchResult = LinqHelper.CreateQuery<IndexedItem>(context, SearchStringModel.ParseDatasourceString(query))
                    .Where(GetDefaultPredicate())
                    .OrderByDescending(p => p.Date)
                    .Take(maxItems);
                return searchResult
                       .GetResults().Hits.ToList();

            }
Used after Hits
using (var context = ContentSearchManager.GetIndex($"sitecore_{_currentDbName}_index").CreateSearchContext())
            {
                var searchResult = LinqHelper.CreateQuery<IndexedItem>(context, SearchStringModel.ParseDatasourceString(query))
                    .Where(GetDefaultPredicate())
                    .OrderByDescending(p => p.Date);
                return searchResult
                       .GetResults().Hits.ToList().Take(maxItems);

            }
Without Sitecore Debugger it would have stayed worse !!
